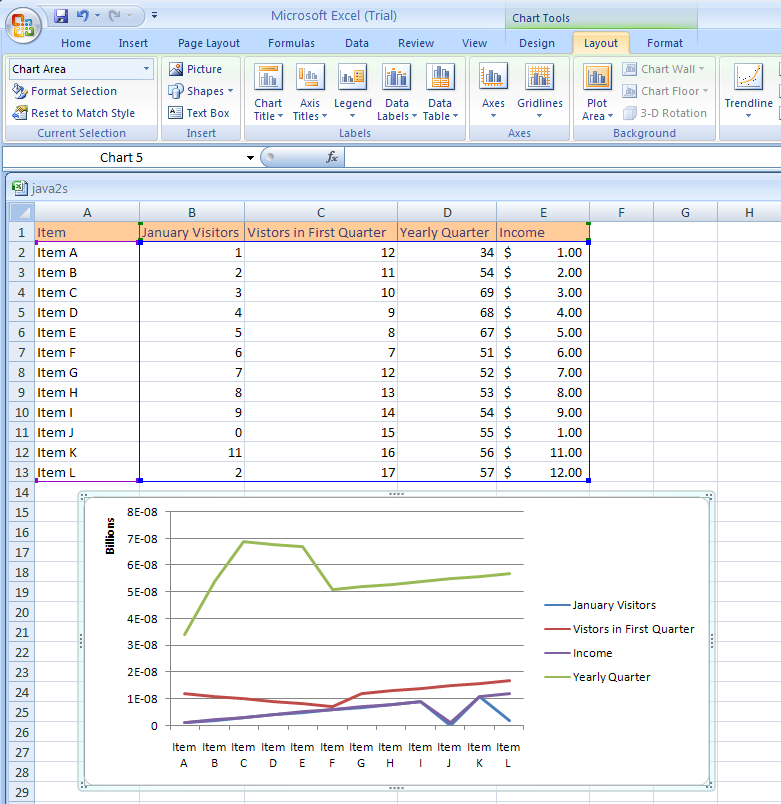
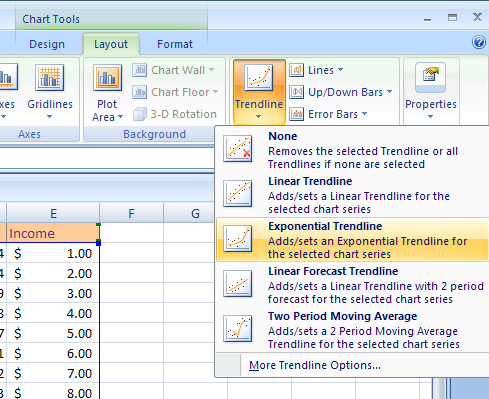
Select the line or bar chart.
           Click the Layout tab under Chart Tools.
Click Trendline to remove or add trendlines:
           Linear, Exponential, Linear Forecast,
and Two Period Moving Average.
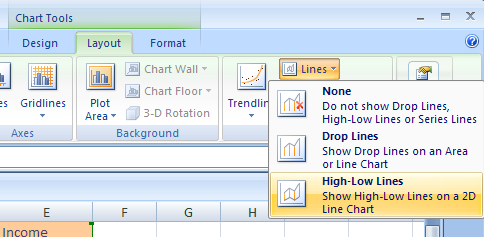
Click Lines to hide Drop Lines, High-Low Lines or
Series Lines.
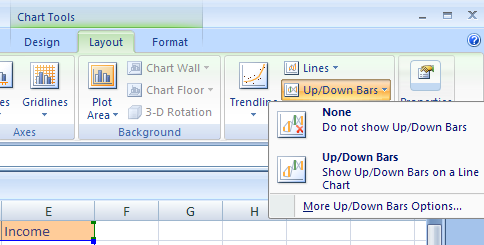
Click Up/Down Bars to hide or show Up/Down Bars.
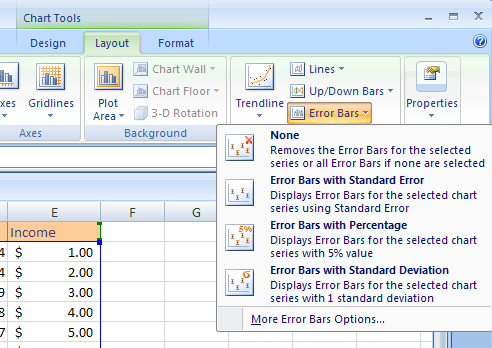
Click Error Bars to hide/show error bars with using
Standard Error, Percentage, or Standard Deviation.

No comments:
Post a Comment