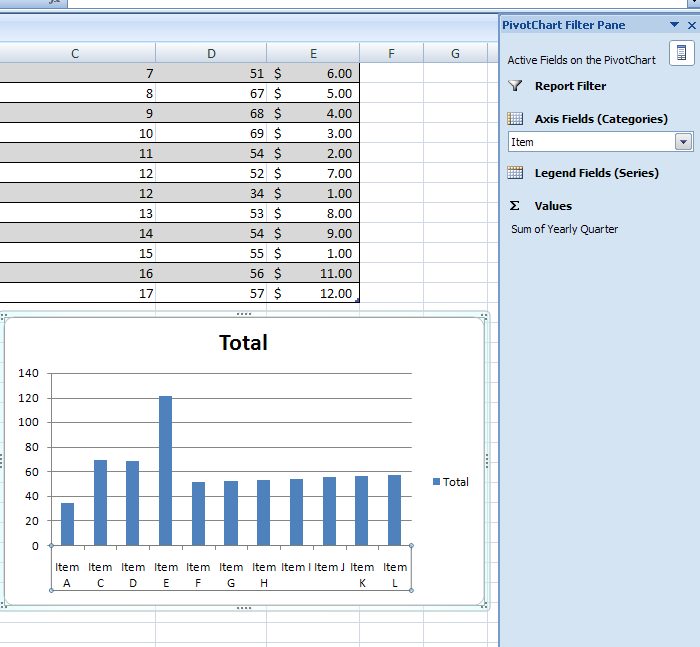
Click the PivotChart.
To filter fields, click the Axis Fields
(Categories) or Legends Fields (Series),
and then select the filter options.
|
|
 |
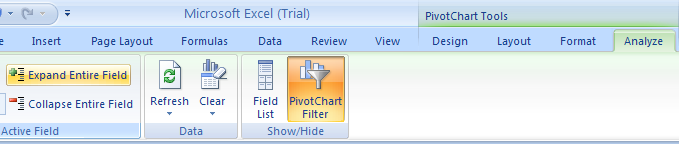
Click the Analyze tab.
Select a field, and then click the Expand Entire
Field or Collapse Entire Field button.
|
|
 |
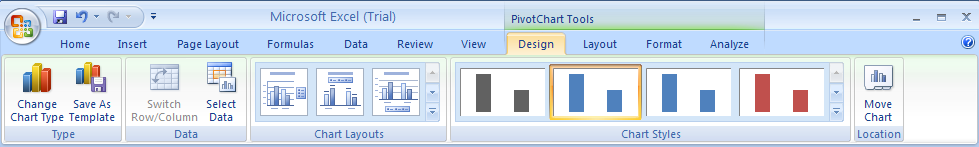
Use Design to change chart styles, layouts, and type.
|
|
 |
Use Layout to change chart labels, axes, and background.
|
|
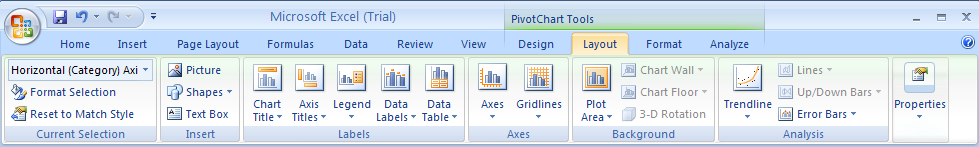 |
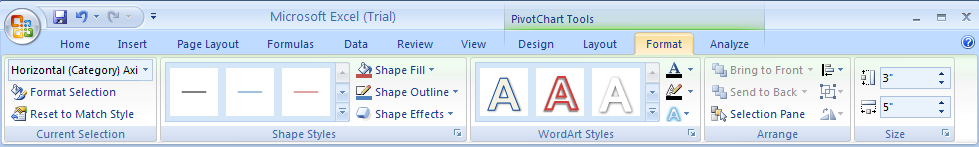
Use Format to format chart elements using Shape and WordArt styles.
|
|
 |

No comments:
Post a Comment