Click anywhere within the table range.
Click the Insert tab.
Click the PivotTable button arrow and
then click PivotTable, or PivotChart.
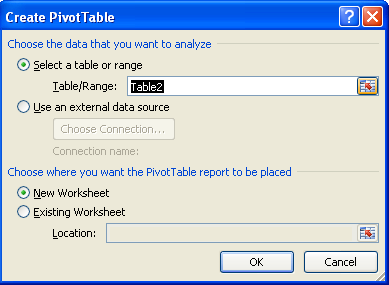
Click the Select a table or range option,
or click the Use an external data source option,
click Choose Connection, and then select a connection.
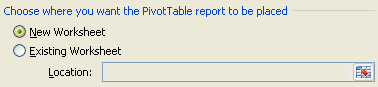
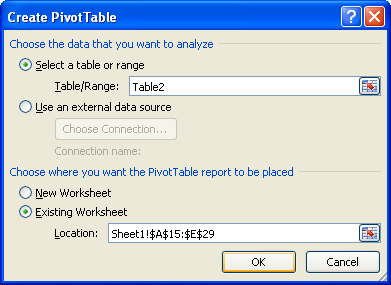
Click the New worksheet option or Existing worksheet option,
           and specify a cell range.
Click OK.
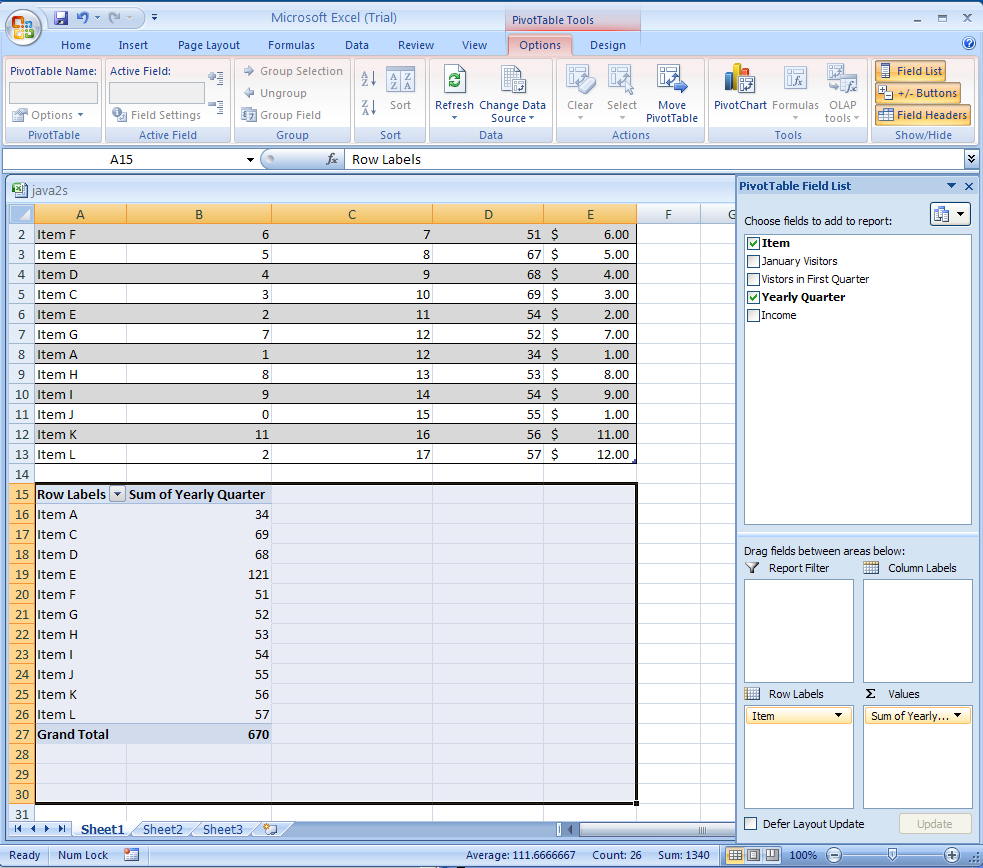
Select the check boxes next to the fields you
want to use to add them to the empty PivotTable.


No comments:
Post a Comment