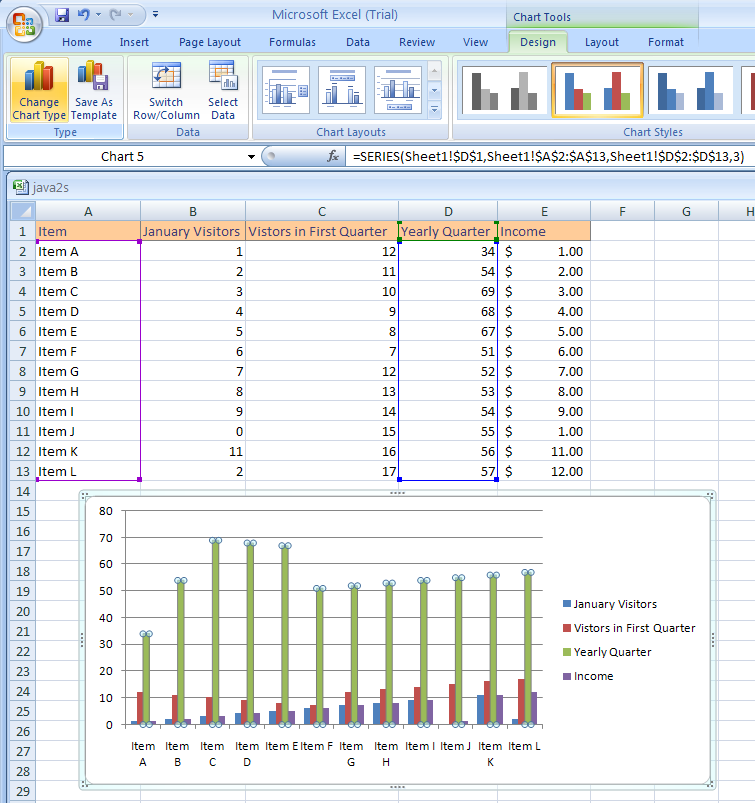
Select the data series in a chart.
           Click the Design tab under Chart Tools.
           Click the Change Chart Type button.
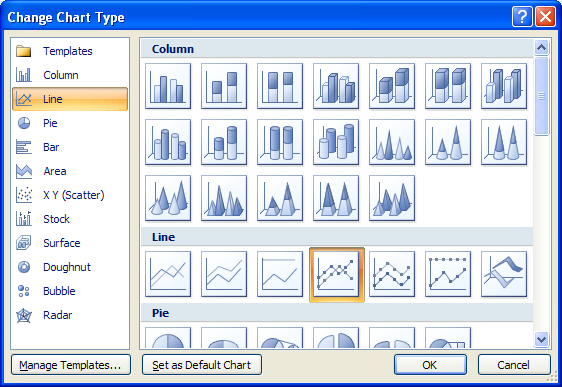
Click the chart type you want.
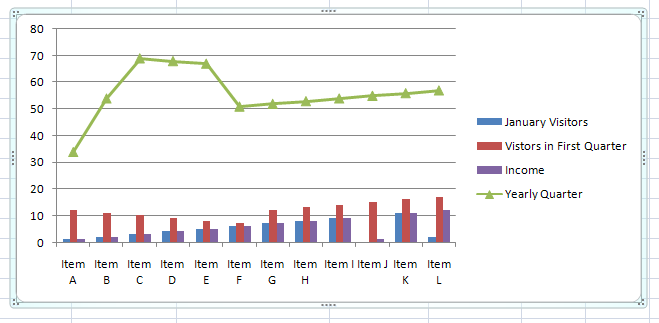
Chart type changed.

No comments:
Post a Comment